Biology IA – What is the effect of varying concentrations of Malathion on the Allium cepa L. as measured by chromosomal aberration frequency and mitotic index?
Research question
What is the effect of varying concentrations of Malathion on the Allium cepa L. as measured by chromosomal aberration frequency and mitotic index?
Introduction
The use of pesticides for both agricultural and non-agricultural purposes is a widespread practice. Their many merits include the ability to control disease-bearing organisms, infestation of plants, and increase crop yield within the agricultural industry (Andreas, 2021). However, research has demonstrated that pesticides have the potential to contaminate local ecosystems with their misuse, damaging the local flora and fauna (Aktar et al., 2009). Pesticide contamination in high concentrations has been detected within abiotic features of ecosystems such as rivers and soil already (Ryberg & Gilliom, 2015). With rising demand for agricultural yields encouraging wider applications of these chemicals, it is important to also consider the possibly detrimental effects such practices have not only on the consumers of this produce, but also the quality and health of the crops themselves.
Background information
Malathion is part of the subgroup of insecticides, and is utilized in products that encompass both household and agricultural practices (NPIC). It is considered a non-systemic insecticide, implying that the chemical may only contaminate the largely external and exposed parts of plants such as pollen, nectar, and outer leaf tissue. The insecticide’s surface residues are at the highest concentration immediately after it is sprayed, with values declining rapidly thereafter (Xerces). It, much like other organophosphate insecticides, works by inhibiting the enzyme acetylcholinesterase (AChE) that usually binds to acetylcholine (ACh) at the nerve junction, preventing the next neuron from being stimulated during a nerve impulse. Due to this attachment, there is an accumulation of ACh at the synapse, leading to an overstimulation of the nervous system of the organism ending in eventual death (National Pesticide Information Center).
Allium cepa L., also known as the onion, is an autotrophic organism. It is a widespread ingredient in a variety of culinary practices worldwide, being known for its aromatic and flavoring properties. Additionally, the onion is also integrated into various medical treatments in order to address problems such as atherosclerosis, dyspepsia, and appetite loss. Onions are commonly analyzed in mitotic index labs due to the rapid division of the apical meristem, as well as the advantage they possess of having a small diploid number of 16 clearly observable chromosomes (SérgioMantovani et al., 2015). Their widespread usage and ability to develop within a short period of time are the primary reasons as to why they were chosen for this experiment.
This exploration will discuss the genotoxic and cytotoxic potential of Malathion on the Allium cepa L. The term “genotoxicity” refers to the ability for a substance (such as Malathion) to damage the genetic information within cells (Ren et al., 2017). This will be observed through chromosomal aberrations—a term synonymous with “chromosomal abnormality.” The primary cause of such a phenomenon is an error in cell division in meiosis or mitosis. They can be classified as either numerical or structural aberrations, where numerical abnormalities refer to changes in the number of chromosomes present, and structural abnormalities refer to a change within the structure of the chromosome itself (Genetic Alliance, 2009). Research has demonstrated that plants are highly susceptible to experiencing this when exposed to specific pesticides, and that specific pesticides induce different types of abnormalities, with some parallel to those exhibited by an animal cell in the same circumstances (Grant, 1978).
Mitotic index is a quantitative tool used to evaluate the rate at which cells divide in a given organism, and an indicator of cytotoxicity, which refers to “the degree to which a substance can cause damage to a cell” (ThermoFisher Scientific)(Zendehboodi, 2018). It measures the proportion of cells within the stages of mitosis (prophase, metaphase, anaphase, telophase) in relation to the total cells observed (including those in interphase). In plants, mitosis happens at the greatest rate in meristems, where cell division is necessary for plant growth. In terms of the Allium cepa L., this is at the apical meristem.
The cell cycle is composed of both interphase and mitosis. Within the interphase there are several stages, including G1, S, G2, and G0. This is where growth of the cell, replication of chromosomes, and several other processes take place that prepare the cell for division. Between each stage of the cell cycle are checkpoints that ensure the cell is still in the appropriate condition to move forward. Cyclin-dependent kinases (CDKs) are the primary reason behind this. Cyclins are proteins that regulate the cell cycle. Whether a cell moves into a specific phase of the cell cycle, for example from G2 to Mitosis, is entirely dependent on cyclin concentration. These proteins function through their activation of CDKs, which result in the formation of a cyclin-dependent kinase complex (CDKC). This complex phosphorylates a previously inactive protein meant to serve a specific function within the cell cycle (Barnum & O’Connell, 2014). Though a high mitotic index may be an indication of mutation of the oncogenes leading to uncontrolled cell division, a lower than usual mitotic index may also be a cause for concern, as it may indicate a disturbance in plant growth (Zendehboodi, 2018).
Studies on the effects of Malathion on the physiology of humans and animals are widespread, with the accumulated ACh at the synapse resulting in possible cramps, muscular weakness, and fatal convulsions, but there is less research in relation to how the insecticide specifically affects plants (Adeyinka & Kondamudi, 2022). One of the few notable instances where a connection between Malathion’s impact on plant development is pursued is through “Determination of malathion’s toxic effect on Lens culinaris Medik cell cycle” (Mercado & Caleño, 2020). Through varying concentrations of Malathion on the Lens culinaris (commonly known as the lentil, another species within the legume family), researchers were able to establish an inversely proportional relationship between concentration of the chemical and root growth over a 72-hour period. Analysis under the microscope also revealed abnormalities within the nuclei and chromosomes of the cell pertaining to abnormalities within the cell cycle.
Variables
The independent variable for this experiment is the concentration of Malathion that the Allium cepa L. is exposed to throughout the duration of the experiment. The values for concentration are all represented as percentages. Each research paper experiments with a range of concentrations that differ from one another in terms of increment, but there is some overlap present in regards to the value. Concentrations of Malathion remain relatively low in all experiments, ranging (beyond the control) from 0.05%–1.5% between all studies.
The dependent variables for this exploration are mitotic index and frequency of chromosomal aberrations (both measured in %). These figures are the result of already processed data, however, raw data (including number of cells analyzed and cells displaying division/chromosomal aberrations) will be used in statistical analysis to perform a Mann-Whitney U Test.
| Controlled variables | How this will be controlled | Significance |
| Period of time exposed to Malathion | Only data collected from onion root after being exposed to Malathion for 24 hours will be addressed in the analyses for each variable. | Giving the roots more time to develop results in further division of the apical meristem, which can affect both the mitotic index and increase the chances of chromosomal aberration frequency. |
| Species of plant | The only data used within this exploration will come from the Allium cepa L. | The onion takes a relatively brief period of time to develop, and the cells within the meristem continue to divide at a rapid rate, providing much visibility in terms of cells in mitosis. This may differ when considering other plants that may not develop their roots as quickly, especially when grown under conditions ideal for onion root development. |
| Type of insecticide | Studies that only use varying concentrations of the Malathion insecticide as their independent variable will be taken into account. | Though Malathion may affect the division of onion root cells similarly to other related chemical solutions, the composition is nonetheless distinct and may lead to minor differences in collected data values. |
| Fixative | Only experiments that first fixed the roots in Carnoy’s Solution (ethanol, glacial acetic acid) were used. | Fixative prevents root tissue from decomposing and bacteria from growing on the collected samples. It will also improve the visibility of the chromosomes in the cells being analyzed. |
| Temperature of environment | All experiments chosen grow the onion roots at approximately 25ºC and away from direct sunlight. | The temperature should be kept consistent, as different temperatures have either positive or adverse effects on the enzymatic activity within the plant cell, encouraging or slowing down growth. |
Table 1. Controlled variables of the experiment
Research Papers
The following papers will be used to varying extents within the investigation to explore the research question, and from now on will be indicated in the exploration as “Source #” in accordance with table 2. Sources 1–3 will primarily be used for the sake of data collation due to the similarity of the procedure of the investigation. Source 4 is used as both a supplement as well as within a Mann-Whitney U Test further in the investigation. Images from Source 5 will be used for discussion on chromosomal aberrations, as well as to corroborate discussion from Sources 1–3.
| No. | Source | Link | Variables Addressed | Reason Chosen |
| 1 | Effect of Organophosphorus Insecticide, Malathion on the Division of Meristems of Allium cepa L. | Link | Mitotic Index | The paper provides detailed mitotic index data, collecting data on the frequencies of the different stages of mitosis in addition to the total number of dividing cells. The method of data collection mostly corresponds with the other procedures utilized for the mitotic index of Allium cepa L., allowing for all variables in Table 1 to be controlled in order to ensure no other factors aside from the independent variable affect the dependent variables among all research papers. Reliability: Published to the International Journal of Pure & Applied Bioscience and has been peer reviewed. |
| 2 | Screening of Cytotoxic and Genotoxic Potency of Two Pesticides (Malathion and Cypermethrin) on Allium cepa L. | Link | Mitotic Index, Chromosomal Aberration Frequency | This paper provides available data on both mitotic index and chromosomal aberration frequency that are able to be verified. It provides a clear procedure and analyzable data. Reliability: Published to Molecular & Cellular Toxicology and is peer reviewed. |
| 3 | Cytotoxic Effect of Malathion and Furadan On Allium cepa L. and Growth Parameters of Oryza Sativa L. | Link | Chromosomal Aberration Frequency | Though this study also analyzes the effects of Malathion on the Oryza Sativa L. as well as the Allium cepa L., there is relevant data on the chromosomal aberration frequency that is provided. Though the primary controlled variables do correspond with the prior studies, the method of growing onion bulbs prior to being submerged in Malathion involves sand rather than just distilled water. Reliability: Published in the International Journal of Multidisciplinary Approach and Studies, a peer-reviewed journal. |
| 4 | Genotoxic Effects of Dithane, Malathion and Garden Ripcord on Onion Root Tip Cells. | Link | Mitotic Index, Chromosomal Aberration Frequency | This source is not a part of the collated data set due to inconsistencies in terms of the period of time the Allium cepa L. was exposed to the Malathion. Otherwise, the paper contains relevant findings and raw data, thus allowing a statistical analysis was able to be conducted on it to support the investigation. Reliability: Published in the African Journal of Food, Agriculture, Nutrition, and Development, a peer-reviewed journal. |
| 5 | Analysis of the Genotoxic Potential of Low Concentrations of Malathion on the Allium cepa Cells and Rat Hepatoma Tissue Culture | Link | Mitotic Index, Chromosomal Aberration Frequency | There are extensive descriptions of the various chromosomal aberrations present within the observed cells that will be useful when explaining the chromosomal patterns that are observed within plant cells as a byproduct of Malathion. There is also information about mitotic index, although to a lesser extent. Reliability: Published in the Journal of Environmental Sciences, an international peer-reviewed journal. |
Table 2. Sources used in the collation of data
Summary of procedures of data collection for each source:
- Onion bulbs were collected, and the base of the onion was cut off and placed in a conical flask containing distilled water at 25ºC. Roots were developed until they reached approximately 0.5mm, after which the bulbs were submerged in ten different concentrations of Malathion (0.1%–0.9%) diluted with distilled water, which also acted as the control. The bulbs were allowed to develop for periods of 24, 48, 72, and 96 hours. Each bulb was then fixed in Carnoy’s Solution for 24 hours and kept in 70% Ethanol at 4ºC until hydrolysis. The roots were warmed gently in 1N HCl and 2% Acetocarmine for 5 minutes. The root tips were then cut off and isolated. A drop of 1% Acetocarmine stain was added to the slide and the root tip was warmed, squashed, and the cover slip was sealed. The roots were then observed under a microscope.
- The lowermost portion of onion bulbs were removed and submerged in distilled water without direct exposure to sunlight for 24 hours. Afterwards, bulbs with approximately equal root lengths were transferred to concentrations of 0.5, 0.10, 0.50, 1.00, and 1.50% Malathion, as well as a control of distilled water for 12 and 24 hours. Roots were then fixed in Carnoy’s solution for 24 hours at 4ºC. Root tips were then washed and preserved in 70% alcohol until further study. In order to make slides, the root tips were gently warmed with 1N HCl and 2% acetocarmine. They were then kept in 1% acetocarmine for 1–3 hours. Root tips were then cut off, warmed, squashed under a coverslip and then observed under a microscope.
- Onion bulbs were collected and grown in sand at room temperature until reaching 1cm. Roots were then rinsed and submerged in different concentrations of Malathion (0.1, 0.5, 0.75, 1.0%) including a control of tap water. The roots were then fixed in Carnoy’s Solution for 6 hours, and then preserved in 70% alcohol until further study. The slides were then prepared with heated acetocarmine and squashed under a coverslip to view under a microscope.
- Onion root tips that measured 1–2cm were fixed with Carnoy’s Solution for 3 hours. After being taken out and washed, 1N HCl preheated to 60ºC was added to the root tips. The roots were then cut to 2mm, stained with aceto-carmine, and squashed under a coverslip.
Because source 5 will not be included within the actual data itself, its procedures will not be explored in detail. Any major differences between this source and sources 1–4 that may be cause for evaluation will be mentioned within the analysis itself.
Methodology of data collection and analysis
- Studies on the Allium cepa L. evaluating the effect of concentrations of Malathion mitotic index and/or chromosomal aberration frequency were researched.
- The methodologies for these studies were summarized to determine if the main factors (time exposed to Malathion, plant type, temperature, fixative, dye) were kept consistent. Only studies that kept these parameters were used within the exploration for data analysis.
- 5 papers were chosen, with sources 1–4 being deemed appropriate for processing, and 5 used for corroboration for chromosomal aberration frequency.
- All chromosomal aberration frequency data (from Sources 2 and 3) were plotted against their respective Malathion concentrations, with different lines of best fit drawn for the different data sets. Regression analysis was performed in order to determine the trends in the data.
- A combined table for chromosomal aberration values was made, using certain chosen percentages of Malathion and extrapolated values from the graph, in order to compare the datasets.
- A Mann-Whitney U test was performed on values from Source 4 to determine the validity of the aberration trend observed in the graph.
- Steps 4–5 were repeated for mitotic index values with values from Sources 1 and 2.
- A conclusion was synthesized based on the information derived from the processed data.
Chromosomal Aberration Frequency
Source 5 mentions a variety of different chromosomal aberrations present within the cells (Bianchi et al., 2015). One of the most common types of abnormalities were chromatin bridges, which are a result of cells entering the process of mitosis with fused chromosomes or sister chromatids (Pampalona et al., 2016). Thus, otherwise segregated masses of chromosomes in anaphase are connected by strings of chromatin, or the nuclei of daughters are connected during cytokinesis (Bradshaw & Stahl, 2016).
Additionally, another common type of aberration resulting from the use of Malathion was chromosome stickiness, which is the intermingling of fibers resulting in chromosomes being stuck to one another due to improper folding of the chromatin into chromatids and chromosomes (Grant, 1978).
The third most frequent type of chromosomal aberration was the presence of nuclear buds, which form in a similar process to micronuclei. They are the product of fragments of chromosomes that remain unenveloped after the reformation of the nuclear envelope, however unlike micronuclei it still has a thin attachment to the nucleus (Krupina et al., 2021).
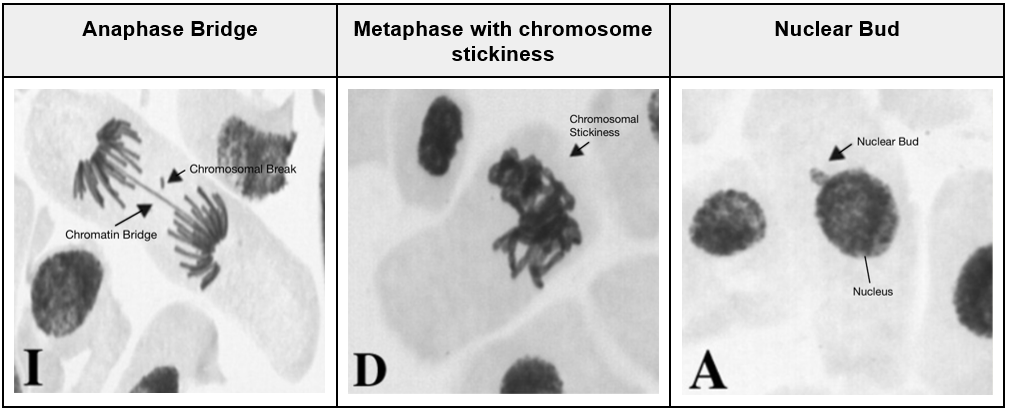
Table 3. Examples of Chromosomal Aberrations from Source 5
Mitotic index percentages were acquired using the following formula (refer to appendices A & B for values):
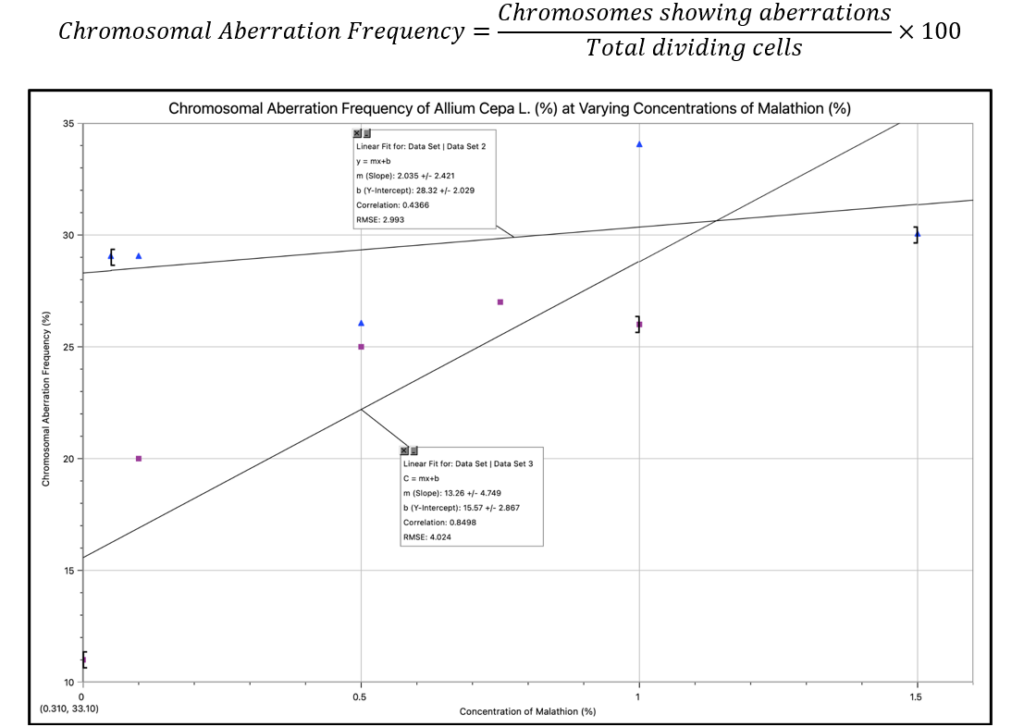
Graph 1. Chromosomal Aberration Frequency (%) of Allium cepa L. at varying concentrations of Malathion (%) (from sources 2&3)
Table 4 includes data provided by Sources 2 and 3. In order to make a direct comparison between the two studies, which did not include concentrations of Malathion within the same increments, the concentrations and frequencies for each dataset were plotted, and missing values were extrapolated from the line of best fit (graph 1). Malathion concentrations from Source 2 were all kept to maintain most of the original data values, and the frequencies with asterisks (*) were extrapolated values (rounded to the nearest integer to maintain consistency with other values).
| Combined Data for Chromosomal Aberration Frequency | ||
| Concentration of Malathion (%) | Chromosomal Aberration Frequency (%) | |
| Source 2 | Source 3 | |
| 0.0 | 28* | 11 |
| 0.05 | 29 | 16* |
| 0.1 | 29 | 20 |
| 0.5 | 26 | 25 |
| 1.0 | 34 | 26 |
| 1.5 | 30 | 36* |
Table 4. Combined Data for Chromosomal Aberration Frequency (Sources 2 & 3)
Although both sets of data follow a positive correlation, Set 3 demonstrates a pattern closer to a linear relationship, with the coefficient of determination, or R2 value, being 0.8498 as opposed to 0.4366 value for Set 2. As the concentration of Malathion is increased, chromosomal aberrations become more frequent. Set 3, although initially beginning at a lower point on the y-axis in comparison to Set 2, has a much steeper slope of 13.26, which implies that there is a greater difference in frequency of aberrations for Set 3 as the concentration of Malathion increases. The combined table displays a similarity between the sets themselves, where although Source 3 begins at 11, the aberration frequency in both sets increases until the 30’s.
There is not a clear reason for why certain aberrations are caused due to Malathion, as its mechanism and how it affects genetic material is highly specific to its own chemical composition. However, it is known that such genotoxic chemicals work by either binding directly to the DNA, or affecting the enzymes involved within the process of DNA replication, resulting in mutation (GreenFacts). Taking this information into account, and observing the trends in the graph, Malathion’s genotoxic potential is strongly implied. However, this will need to be verified through additional statistical analysis:
| Concentration of solution (%) | Source 4: Number of aberrant cells/1000 observed | ||||
| Prophase | Metaphase | Anaphase | Telophase | Total | |
| 0.000 | 0.00 | 0.00 | 0.00 | 0.00 | 0.00 |
| 0.034 | 6.30 | 4.31 | 2.98 | 1.66 | 32.81 |
| 0.069 | 1.63 | 4.56 | 4.56 | 0.65 | 20.53 |
| 0.137 | 4.99 | 6.98 | 5.65 | 2.00 | 43.23 |
Table 5. Chromosomal aberration frequencies from Source 4 separated by stages of Mitosis
A Mann-Whitney U Test will be performed on the values to determine if there is a valid relationship between the presence of Malathion in all concentrations and the occurrence of chromosomal aberrations. These data were taken from Source 4, meaning that the values collected come from a 20 hour period of exposure rather than a 24 hour period. However, because this source is being examined individually rather than in comparison to other sources, it is not as necessary to control that variable. This method of statistical analysis was chosen over a t-test because the data is not normally distributed. The aberrant cells for each concentration of malathion within each stage of the cell cycle were analyzed against the data available for the control (0.000%), and there are two possible hypotheses that may come from this test:
- Null hypothesis (statistically insignificant): There is no difference in the chromosomal aberration frequency when 0.000% or a higher specific concentration of Malathion is used.
- Alternative hypothesis (statistically significant): There is a difference in the chromosomal aberration frequency when 0.000% or a higher specific concentration of Malathion is used.
The values for the test were calculated with Social Science Statistics. Within the example below, Sample 1 is the control, and Sample 2 was the 0.034% Malathion. This process was also repeated with 0.069% and 0.137%.
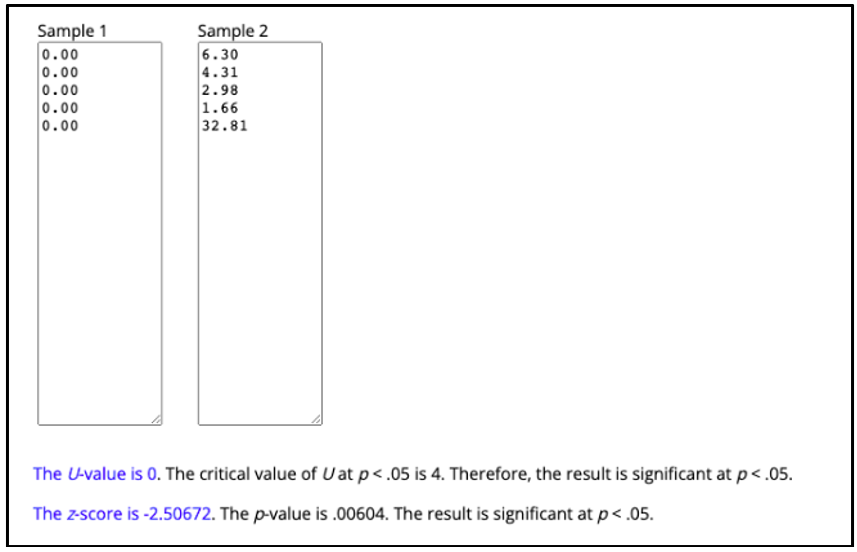
Figure 1. Mann-Whitney U Test for chromosomal aberration frequency
The U-value for all of the three concentrations was calculated to be zero. A low U-value within the test indicates that there is less of a likelihood that there is a relationship that occurred by chance. These results, as well as the results for the other concentrations, were considered statistically significant as the one-tailed p-values were less than 0.05. Therefore, the alternative hypothesis is adopted which establishes that changes in Malathion concentration do have an effect on the frequency of chromosomal aberrations of a specific sample.
Mitotic Index
Mitotic index percentages were acquired using the following formula (refer to appendices C & D for values):

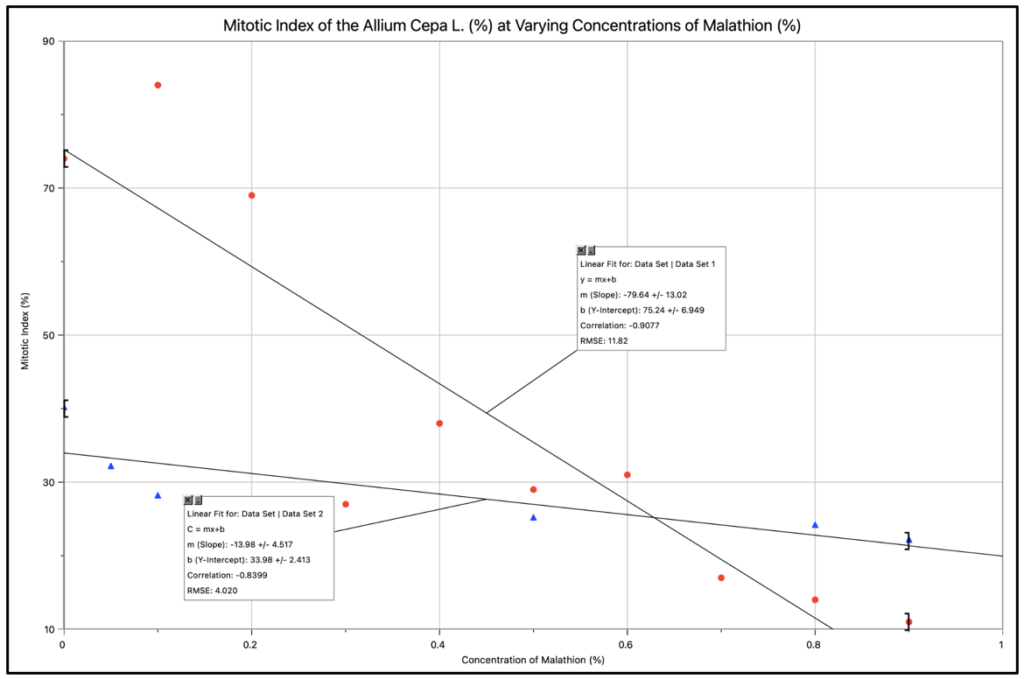
Graph 2. Mitotic Index of Allium cepa L. (%) at varying concentrations of Malathion (%) (from sources 1&2)
The same extrapolation method as used prior in chromosomal aberration frequency was also applied to compare values for mitotic index between Sources 1 and 2, with the Malathion concentrations for Source 2 being kept in order to limit the number of extrapolated values (indicated with an asterisk [*] and rounded to the nearest integer). Mitotic indices for 1.0 and 1.5% for Source 1 were unable to be extrapolated, as those values appeared below the x-axis (thus being negative and impossible), due to the higher gradient of the line of best fit.
| Combined Data for Mitotic Index | ||
| Concentration of Malathion (%) | Mitotic Index (%) | |
| Source 1 | Source 2 | |
| 0.0 | 74 | 40 |
| 0.05 | 71* | 32 |
| 0.1 | 84 | 28 |
| 0.5 | 29 | 25 |
| 1.0 | – | 24 |
| 1.5 | – | 22 |
Table 6. Combined Data for Mitotic Index (Sources 1 & 2)
It is apparent that although both sets of data do vary in terms of the rates at which their mitotic indices decrease, there is still a general trend where as the concentration of Malathion is increased, the mitotic index declines in return. Data from Source 1 declines at a greater rate, with a slope of -79.64 in comparison to the slope of Source 2, which declines approximately 6 times slower at a gradient of -13.98. The R2 is also given, which indicates that both sets align closely with the line of best fit. However, it is Set 1 that has greater accuracy in regards to its alignment due to its -0.9077 being closer to -1 in comparison to the R2 of Set 2, which is -0.8399. The aberration values on the table according to both sources, although both demonstrating a decrease, do not demonstrate much similarity.
By observing a relationship between concentrations of Malathion and decline in mitotic index, one is able to discern Malathion’s cytotoxicity. In the context of the information that has been presented thus far, a likely explanation as to why the cells are no longer dividing as frequently is due to Malathion’s genotoxicity, which was mentioned prior in regards to chromosomal aberrations. Because there was an increase of the frequency of abnormalities within increasing concentrations of Malathion, CDK activity dictates that cells within the cell cycle no longer move past the next checkpoint in order to prevent cell proliferation. This is a protective measure to prevent the continued production of cells with aberrant chromosomes. Thus, less cells can be counted to be in mitosis, reducing the mitotic index in turn and confirming Malathion’s cytotoxic properties.
Conclusion
Based on the evidence of the investigation, both chromosomal aberration frequency and mitotic index are affected by changes in the concentration of Malathion in the Allium cepa L. In terms of chromosomal aberration frequency, it can be observed in graph 1 that there is a moderate positive correlation that can be observed between frequency and concentration, with data set 3 providing greater evidence of a linear relationship in comparison to data set 2. This positive correlation may be due to Malathion acting as a mutagen towards the Allium cepa L. cells, resulting in an error in mitosis that yielded irregularities such as sticky chromosomes and chromatin bridges. Therefore, higher concentrations of Malathion will be more effective in disrupting and causing error in the cell cycle, thus indicating the derived relationship.
Mitotic index data demonstrated a fairly strong negative correlation, where in graph 2, it can be observed that both linear lines of best fit slope downwards with fairly strong R2 values. Because Malathion’s genotoxic potential has been previously established, conclusions on Malathion’s cytotoxicity were able to be drawn from the mitotic index data supplemented by the previous claim. Due to the increased concentrations of aberrant chromosomes due to Malathion affecting either binding to the DNA itself or affecting the enzymes related to DNA replication—resulting in mutation, the plant cells are less likely to go through the cell cycle up to mitosis itself due to CDK-activated checkpoints between each stage preventing the spread of mutated genes. Thus, not only can a relationship be deduced between the independent variable and each dependent variable that was explored, but there appears to be a link between the measures of chromosomal aberration frequency and mitotic index as well.
Evaluation
| Strengths | Significance |
| Reputable sources | The sources that were chosen for this investigation were all peer reviewed academic texts, with many published to international journals. This improves the credibility of the data that was then collated as it speaks to the integrity and reliability of the procedure presented, the results obtained, and the subsequent evaluation of the results—all factors that were considered in this exploration. |
| Highly consistent procedure (between sources 1&2) | Data from sources 1 and 2 were used to draw conclusions on mitotic index. As no additional statistical analysis was performed in order to verify the validity of the relationship of the variables, it was necessary to make sure that any other external factors that would influence changes within the data were as limited as possible. |
| Multiple methods of statistical analysis applied | This exploration took advantage of multiple modes of statistical analysis in order to interpret the data. Regression analysis was used, where the value of the coefficient of determination (R2) was evaluated as well as the equations of the lines of best fit in order to draw a conclusion from the data. In addition to this method, the Mann-Whitney U Test was also performed for chromosomal aberration frequency data in order to confirm the relationship between the IV and DV. This was beneficial, as the additional statistical analysis was able to partially make up for the lesser degree of correspondence sources 2 and 3 had. |
Table 7. Strengths of the investigation
| Limitations | Significance | Improvements |
| Less consistent procedure (between sources 2&3) | Although source 2 had a strong correspondence in terms of procedure to source 1, the method of rooting the Allium cepa L. was vastly different in comparison to source 3. Rather than growing the bulbs in distilled water, source 3 grew the bulb in sand. This difference in the procedure of the initial growth of the Allium cepa L. may have posed the possibility of having an impact on the final collected and plotted data values, which would influence interpretations and analyses. | Gather data that has a greater similarity in terms of procedure. If that is not possible, look into doing an additional statistical test in order to determine the validity of the relationship of the data that was collected. |
| Only 3 papers used for data collation | Though Source 4 was used for the statistics test, and 5 for evidence for chromosomal aberrations, only Sources 1–3 were properly graphed and put into tables. This number of collated sources is not enough to make a definite determination on Malathion’s true cytotoxic and genotoxic potential. | The limited nature of the experiments was due to attempts to control a wide variety of variables throughout studies. Therefore, taking more data into account that has slight variation (ex. not the same fixative used) could yield more sources, but a wider degree of evaluation would need to be performed. |
| Variation in number of cells analyzed | The number of cells analyzed for mitotic index and chromosomal aberrations varied to a great extent both between different sources, but also specific concentrations within a singular data set as well. This allows certain calculated values to have a much greater degree of accuracy compared to others due to the larger sample size. | Opt for data sets that have more cells analyzed, thus a larger sample size. If there is an immense disparity in the values within one data set, consider excluding the value or making a remark on its uncertainty. If there is inconsistency between data sets, note the uncertainty but place a greater emphasis on whether or not the same trends are being observed in the data. |
| Lack of error bars within analysis leading to uncertainty | Because this is a secondary data investigation, there was very limited access to measurements of uncertainties as well as raw data to determine ranges in order to construct error bars. Because of this, the uncertainty of data is relatively high. | Gaining access to raw data should be made a priority. This will not only allow for the evaluation of uncertainty within the data, but also allow a greater array of statistical tests to be performed on the dataset. |
Table 8. Weaknesses of the investigation
Further Investigations
- A further investigation can be conducted to focus on the exploration of other dependent variables in order to gain a wider idea of the many effects organophosphates have on plants. A study conducted on the Allium cepa L. about varying concentrations of Malathion was able to establish, through the measurement of water content, that the insecticide was damaging the cell membrane leading to limited potential for osmosis (Srivastava & Singh, 2020).
- Interestingly, much like source 3 used in this investigation, the study mentioned prior also rooted their Allium cepa L. in sand. Thus, an exploration into the various methods of preparing the Allium cepa L. and how they may affect the outcome of results may be warranted.
- It may also be appropriate to investigate the similarities and differences in how Malathion affects animals and plants. Although it is known to be dangerous to both groups, the manner in which the chemical inflicts harm is very different.
References
Adeyinka, & Kondamudi. (2022). Cholinergic crisis – statpearls – NCBI bookshelf. Retrieved January 9, 2023, from https://www.ncbi.nlm.nih.gov/books/NBK482433/
Aktar, M. W., Sengupta, D., & Chowdhury, A. (2009, March). Impact of pesticides use in agriculture: Their benefits and Hazards. Interdisciplinary toxicology. Retrieved January 9, 2023, from https://www.ncbi.nlm.nih.gov/pmc/articles/PMC2984095/#:~:text=Pesticides%20can%20contaminate%20soil%2C%20water,%2C%20and%20non%2Dtarget%20plants.
Andreas. (2021, December 4). 30 Major Pros & Cons of Pesticides & Herbicides. E&C. Retrieved January 9, 2023, from https://environmental-conscience.com/herbicides-pesticides-pros-cons/
Asita, A. O., & Makhalemele, R. (2009). Genotoxic effects of Dithane, Malathion and garden ripcord on onion … National University of Lesotho. Retrieved January 9, 2023, from https://www.researchgate.net/publication/43554852_Genotoxic_effects_of_dithane_malathion_and_garden_ripcord_on_onion_root_tip_cells
Barnum, K. J., & O’Connell, M. J. (2014). Cell cycle regulation by checkpoints. Methods in molecular biology (Clifton, N.J.). Retrieved January 9, 2023, from https://www.ncbi.nlm.nih.gov/pmc/articles/PMC4990352/#:~:text=Cell%20cycle%20checkpoints%20are%20surveillance,their%20accurate%20segregation%20at%20mitosis
Bianchi, J., Mantovani, M. S., & Marin-Morales, M. A. (2015). Analysis of the genotoxic potential of low concentrations of malathion on the allium cepa cells and rat hepatoma tissue culture. Journal of environmental sciences (China). Retrieved January 9, 2023, from https://pubmed.ncbi.nlm.nih.gov/26456612/
Bradshaw, R. A., & Stahl, P. D. (2016). Encyclopedia of Cell Biology. ScienceDirect. Retrieved January 9, 2023, from https://www.sciencedirect.com/referencework/9780123947963/encyclopedia-of-cell-biology
Cytotoxicity assays. Thermo Fisher Scientific – US. (n.d.). Retrieved January 9, 2023, from https://www.thermofisher.com/th/en/home/life-science/cell-analysis/cell-viability-and-regulation/cytotoxicity.html#:~:text=Cytotoxicity%20is%20the%20degree%20to,and%20%22toxic%22%20meaning%20poison
Das, L., Hasnu, S., Shandilya, Z. M., & Tanti, B. (1970, January 1). Cytotoxic effect of malathion and Furadan on allium cepa L. and growth parameters of Oryza sativa L. Semantic Scholar. Retrieved January 9, 2023, from https://www.semanticscholar.org/paper/Cytotoxic-Effect-of-Malathion-and-Furadan-On-Allium-Das-Hasnu/0e509b7cc1f5cadab179ff790d4484fab6c35b0d
Genetic Alliance. (2009). Chromosomal abnormalities – understanding genetics – NCBI bookshelf. Understanding Genetics: A New York, Mid-Atlantic Guide for Patients and Health Professionals. Retrieved February 3, 2023, from https://www.ncbi.nlm.nih.gov/books/NBK115545/
Gogoi, P., Das, S., Das, S., & Khan, Z. (2016). Effect of organophosphorus insecticide, malathion on the division of … Retrieved January 9, 2023, from https://www.researchgate.net/profile/Sayak-Das/publication/308036907_Effect_of_Organophosphorus_Insecticide_Malathion_on_the_Division_of_Meristems_of_Allium_cepa_L/links/580f17f408ae8e16f6e6171e/Effect-of-Organophosphorus-Insecticide-Malathion-on-the-Division-of-Meristems-of-Allium-cepa-L.pdf
Grant, W. F. (1978, December). Chromosome aberrations in plants as a monitoring system. Environmental health perspectives. Retrieved January 9, 2023, from https://www.ncbi.nlm.nih.gov/pmc/articles/PMC1637299/
GreenFacts. (n.d.). Glossary: Genotoxic. Retrieved February 3, 2023, from https://ec.europa.eu/health/scientific_committees/opinions_layman/en/electromagnetic-fields/glossary/ghi/genotoxic-genotoxicity.htm#:~:text=Definition%3A,birth%20defects%20(inheritable%20damage)
Krupina, K., Goginashvili, A., & Cleveland, D. W. (2021, June). Causes and consequences of micronuclei. Current opinion in cell biology. Retrieved January 9, 2023, from https://www.ncbi.nlm.nih.gov/pmc/articles/PMC8119331/#:~:text=Micronuclei%20(MN)%20are%20small%20nuclei,completion%20of%20mitosis%20or%20meiosis.
Malathion. National Pesticide Information Center. (n.d.). Retrieved January 9, 2023, from http://npic.orst.edu/factsheets/malagen.html
Mann-Whitney U Test Calculator. Social Science Statistics. (n.d.). Retrieved January 9, 2023, from https://www.socscistatistics.com/tests/mannwhitney/
NPIC. (n.d.). Malathion. National Pesticide Information Center. Retrieved January 9, 2023, from http://npic.orst.edu/factsheets/archive/malatech.html#:~:text=Target%20Organisms,%2C%20ingestion%2C%20and%20inhalation%20exposure.&text=Malathion%20and%20other%20organophosphate%20insecticides,of%20insects%20and%20other%20organisms.
Pampalona, J., Roscioli, E., Silkworth, W. T., Bowden, B., Genescà, A., Tusell, L., & Cimini, D. (2016, January 19). Chromosome bridges maintain kinetochore-microtubule attachment throughout mitosis and rarely break during anaphase. PloS one. Retrieved January 9, 2023, from https://www.ncbi.nlm.nih.gov/pmc/articles/PMC4718638/
Ren, N., Atyah, M., Chen, W.-Y., & Zhou, C.-H. (2017, May 22). The various aspects of genetic and epigenetic toxicology: Testing methods and clinical applications – journal of translational medicine. BioMed Central. Retrieved February 3, 2023, from https://translational-medicine.biomedcentral.com/articles/10.1186/s12967-017-1218-4
RJ;, R. K. R. G. (2015). Trends in pesticide concentrations and use for major rivers of the United States. The Science of the total environment. Retrieved January 9, 2023, from https://pubmed.ncbi.nlm.nih.gov/26318227/
Salazar Mercado, S. A., & Quintero Caleño, J. D. (2020, September 6). Determination of malathion’s toxic effect on lens culinaris medik cell cycle. Heliyon. Retrieved January 9, 2023, from https://www.ncbi.nlm.nih.gov/pmc/articles/PMC7486440/
Sheikh, N., Patowary, H., & Laskar, R. A. (2020, April 3). Screening of cytotoxic and genotoxic potency of two pesticides (malathion and cypermethrin) on allium cepa L. – Molecular & Cellular Toxicology. SpringerLink. Retrieved January 9, 2023, from https://link.springer.com/article/10.1007/s13273-020-00077-7
Srivastava, A. K., & Singh, D. (2020, January 21). Assessment of malathion toxicity on cytophysiological activity, DNA damage and antioxidant enzymes in root of allium cepa model. Nature News. Retrieved January 9, 2023, from https://www.nature.com/articles/s41598-020-57840-y#:~:text=The%20results%20revealed%20that%20malathion,adjustment%20due%20to%20membrane%20damage.
Systemic insecticides: A reference and Overview. The Xerces Society for Invertebrate Conservation. (n.d.). Retrieved January 9, 2023, from https://xerces.org/systemic-insecticides-reference-and-overview#:~:text=Systemic%20insecticides%20are%20intended%20to,surface%20residues%20shortly%20after%20application.
SérgioMantovani, M., Titenko-Holland, N., Srivastava, K., Soloneski, S., Shimizu, N., Sankararamakrishnan, N., Rank, J., Rai, D. K., Oliveira, R. J., Nordberg, J., Moore, P. D., Mazzeo, D. E. C., Mantovani, M. S., Malatesta, M., Ma, T. H., Leme, D. M., Laine, D. F., John, S., Hartmann, A., … Bolle, P. (2015, July 11). Analysis of the genotoxic potential of low concentrations of malathion on the allium cepa cells and rat hepatoma tissue culture. Journal of Environmental Sciences. Retrieved January 9, 2023, from https://www.sciencedirect.com/science/article/abs/pii/S1001074215002855
Zendehboodi, Z. (2018, September 12). Cytotoxicity and genotoxicity effects of water boiled in aluminum vessels on allium cepa root tip cells. Journal of environmental health science & engineering. Retrieved February 3, 2023, from https://www.ncbi.nlm.nih.gov/pmc/articles/PMC6277333/
Appendices
Appendix A
| Source 2: Chromosomal Aberration Data | |||
| Concentration of Malathion (%) | Total cells analyzed | Total aberrant cells | Chromosomal aberration frequency (%) |
| 0.0 | 281 | – | – |
| 0.05 | 98 | 28 | 29 |
| 0.1 | 82 | 24 | 29 |
| 0.5 | 66 | 17 | 26 |
| 1.0 | 61 | 21 | 34 |
| 1.5 | 50 | 15 | 30 |
Appendix B
| Source 3: Chromosomal Aberration Data | |||
| Concentration of Malathion (%) | Total cells analyzed | Total aberrant cells | Chromosomal aberration frequency (%) |
| 0.0 | 503 | 45 | 11 |
| 0.1 | 305 | 60 | 20 |
| 0.5 | 297 | 73 | 25 |
| 0.75 | 315 | 84 | 27 |
| 1.0 | 351 | 91 | 26 |
Appendix C
| Source 1: Mitotic Index Data | |||
| Concentration of Malathion (%) | Total cells analyzed | Cells showing division | Mitotic index (%) |
| 0.0 | 98 | 72 | 74 |
| 0.1 | 93 | 78 | 84 |
| 0.2 | 100 | 69 | 69 |
| 0.3 | 55 | 15 | 27 |
| 0.4 | 64 | 24 | 38 |
| 0.5 | 71 | 20 | 29 |
| 0.6 | 94 | 29 | 31 |
| 0.7 | 89 | 15 | 17 |
| 0.8 | 103 | 14 | 14 |
| 0.9 | 100 | 11 | 11 |
Appendix D
| Source 2: Mitotic Index Data | |||
| Concentration of Malathion (%) | Total cells analyzed | Cells showing division | Mitotic index (%) |
| 0.0 | 281 | 113 | 40 |
| 0.05 | 311 | 98 | 32 |
| 0.1 | 291 | 82 | 28 |
| 0.5 | 262 | 66 | 25 |
| 1.0 | 250 | 61 | 24 |
| 1.5 | 231 | 50 | 22 |