Chemistry IA – What is the effect of varying the masses (0.000g, 0.020g, 0.040g, 0.060g, 0.080g, 0.100g) of ⍺-amylase inhibitor on the rate constant of a starch hydrolysis reaction?
Introduction
I’ve always found satisfaction in connecting the content I learn in different classes together, particularly in the sciences where I am able to observe how various disciplines view similar concepts through different lenses. I was first introduced to the function and importance of enzymes within the human body in IB Biology, and while completing a lab related to modeling the hydrolysis of starch in the small intestine, I heard the word “catalyst” mentioned a lot. I thought back to the Kinetics unit of Chemistry, where we studied the effects of catalysts on speeding up chemical reactions.
As an extension of what I knew biologically about enzymes (which are catalysts), I also recalled there was a brief mention in class of the existence of enzyme inhibitors, which hinder the activity of enzymes. Thus, I was curious about how such a process could be explored chemically in relation to the rate constant.
Research question
What is the effect of varying the masses (0.000g, 0.020g, 0.040g, 0.060g, 0.080g, 0.100g) of ⍺-amylase inhibitor on the rate constant of a starch hydrolysis reaction?
Background information
The starch hydrolysis reaction is an immensely significant reaction when it comes to human digestion. It is the primary step in the breakdown of carbohydrates, one of the main metabolic molecules, in order to be absorbed into the human body. Starch is a macromolecule that consists of linkages of (C6H10O5)n. Its monomer is glucose (C6H12O6), but because the molecule is linked via condensation reactions, two hydrogens and one oxygen (water) are missing (Britannica, 2022). When starch enters the body, the enzyme amylase (from both the saliva and pancreas) in different stages of digestion catalyzes the breakdown of starch into maltose. Two glucose units are removed at a time from starch to form the disaccharide. The reaction is as follows:
(C6H10O5)n + H2O → n/2 C12H22O11
Note that no ⍺-amylase (C9H14N4O3) is present in the overall reaction, as it is a catalyst. Catalysts work by lowering the activation energy of a reaction, which is the minimum amount of energy that particles need to collide for a chemical reaction to happen (Libretexts, 2020). They introduce an alternate pathway with a faster rate of reaction. Maltose is further broken down into glucose with the enzyme maltase, which can be used by the body for ATP in cellular respiration and glycogen storage. This pathway of breakdowns is necessary because the starch molecule is too large to be able to absorb into the epithelial cells that line the lumen of the small intestine (Allott, 2014). If the primary catabolism of starch does not occur, the body will not be able to access its glucose monomers, and the starch will pass through the body unconsumed.
Carb blockers are a type of diet pill that, instead of suppressing appetite or increasing fullness (Mayo Clinic, 2020) like the common supplement, work to reduce or outright prevent the breakdown of complex carbs within the body (Jones, 2021). They can serve this function due to containing a vital ingredient: enzyme inhibitors. These inhibitors work to reduce the activity of enzymes which catalyze the breakdown of macromolecules. One such example of an enzyme inhibitor commonly found in carb blockers is an ⍺-amylase inhibitor, which can be derived primarily from the kidney bean as well as found in lower concentrations in other legumes, like peas and lentils. It impacts the function of salivary and pancreatic amylase secreted during the process of digestion (Caballero, 2003).
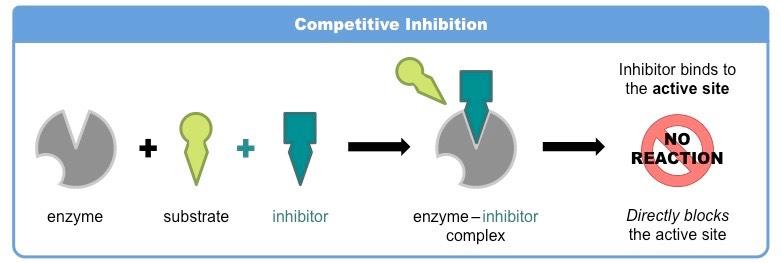
Fig 1. Mechanism for competitive inhibition (Cornell, 2016)
Enzyme inhibitors can be both competitive, and non-competitive. The ⍺-amylase inhibitor is a competitive type, meaning that the particle takes on a similar shape to the substrate. As pictured in figure 1, it is able to “compete” with the substrate for the active site of the enzyme to form either an enzyme-substrate complex, resulting in a reaction and a product being formed, or an enzyme-inhibitor complex, resulting in no reaction (Cornell, 2016). This temporarily prevents the substrate from being able to access the enzyme’s active site, thus slowing down the rate of reaction. This type of reaction is reversible, as the inhibitor is able to unbind itself from the enzyme.
The conversion from starch to maltose can be witnessed with the use of an iodine-starch test, which tests for the presence of starch in a solution. When Lugol’s iodine (an aqueous solution of molecular iodine and potassium iodide) interacts with starch, a dark blue color can be witnessed. I2 is insoluble, but when it reacts with the I– from the KI, I3– (triiodide ion) is formed which can then continue to react with I2 to form polyiodide ions with the form In–. Starch is composed of amylose, which has a linear unbranched helical structure, and amylopectin, which is a branched helix. When polyiodide ions come into contact with amylose, the linear helical structure allows it to be bound inside the glucose chains. This forms a charge transfer (CT) complex, with the amylose acting as a charge donor and the polyiodide acting as a charge acceptor. The electrons of the polyiodide become excited when light is passed through and the complex absorbs a specific wavelength from the visible light spectrum. When they return back to their ground state, a photon of light is emitted that results in the complementary color (in this case, dark blue) being observed (Hickman, 2022).
This concept can be used in order to calculate the presence of starch over time in a reaction. Because maltose does not have a dark blue color, the continuous hydrolysis of starch catalyzed by amylase will result in the substance lightening and becoming clear. Transmittance and absorbance values can be measured with a colorimeter to observe enzymatic activity.
Hypothesis
As the mass of ⍺-amylase inhibitor is increased during the reaction, the enzymatic activity of the amylase will be negatively affected. Though the catalyst lowers the activation energy of the reaction, the diet pills will hinder its effectiveness. Therefore, the inhibitor will result in the starch hydrolysis reaction being significantly slowed, resulting in the rate constant values becoming smaller. Because of this, less particles will be able to collide with enough energy to form maltose, the product. I predict that this trend will be linear, with the differences in mass being directly proportional to the differences in the values of k.
Variables
| Independent variable | Values (±0.001) (g) | How this will be varied |
| Mass of Inhibitor | 0.000, 0.020, 0.040, 0.060, 0.080, 0.100 | Different masses of powdered inhibitor taken from diet capsules were measured on a precision balance and combined with 1.0mL of starch to be put in cuvettes and reacted with the rest of the materials. |
Table 1. Independent variable
| Dependent variable | How this will be measured |
| Rate constant k | A colorimeter will record data on the absorbance valued during the reaction. Calculations can then be carried out to find the rate constant of the reaction. |
Table 2. Dependent variable
| Controlled variables | How this will be controlled | Significance |
| Temperature | A boiling tube with amylase was placed in the water bath at all times. After initially placing it in the water, the solution was given 5 minutes to sit so the temperature is properly adjusted to the same temperature as the water outside. A thermometer was used to ensure the solution maintains a constant temperature of 37.0ºC. | The optimal temperature for the activity of amylase is 37.0ºC because amylase is an enzyme located in the human body, where the temperature averages about 37.0ºC. A lower or higher temperature would mean that the effectiveness of the enzyme would be impacted, resulting in inconsistent data. |
| Mass of ⍺-amylase inhibitor throughout trials | A precision balance rather than an electronic balance was used to measure out the masses of the ⍺-amylase inhibitor. A stirring rod was used to gently tip small masses of the powder onto the watch glass (which was on the scale) until the mass reached the desired amount. | It was important to keep the masses measured constant throughout every trial in order to prevent any possible inhibitor-related unintended variation in the data collected. |
| Quality of starch and amylase | After each day of experimentation, the starch and amylase were kept in the fridge in order to ensure the solutions would not expire for the next day of experimentation. If (especially the starch) was suspected to have gone bad, a drop of iodine would be added to a sample of the starch. A dark blue color would have indicated functional starch, but a murky brown color meant it was no longer usable. | Using expired starch and/or amylase solution in the reaction resulted in the data for the experiment in certain trials being substantially impacted and thus completely discarded. The effectiveness of the solutions were incredibly diminished and thus graphs would be inconsistent. |
| Absorbance data | The same colorimeter was used throughout the experiment, with the wavelength set at 430nm to detect the presence of the yellow inhibitor. A cuvette containing a blank was always used between each round of data collection in order to calibrate the colorimeter. | Graphs looked very different based on the wavelength the colorimeter was set to due to its detection of a specific color. Re-calibrating the colorimeter between each trial made sure that all data was recorded from the same standard of transmittance/absorbance. |
| Concentrations of iodine, amylase and starch | Iodine, amylase, and starch were all ordered in large quantities (mixed in their specific concentrations) in order to keep the concentrations of the solutions as constant as possible. The starch solution was gently shaken everytime a sample was needed in order to reintegrate the starch particles that had settled at the bottom of the bottle. | Having a consistent concentration of each solution, in addition to a consistent volume, ensures that the effect of only varying the independent variable (mass of ⍺-amylase inhibitor) is observed. |
| Volumes of amylase and starch | 10.0mL graduated cylinders were used to measure out the volumes of solution needed in the experiment. Pipettes were used in the transfer of the liquid. | Much like the concentration, keeping a consistent volume of amylase and starch was vital in order to only ensure changes in the independent variable were measured. |
| Cross-contamination | All graduated cylinders and pipettes were labeled with a specific color of marker to prevent cross-contamination. Red: amylase, blue: starch, green: starch and inhibitor. | Because smaller quantities of each solution were used, it was especially important that absolutely no volumes reacted outside of the colorimeter, which would result in data that demonstrated a lower than normal absorbance. |
| Uniform reaction | All cuvettes were briefly shaken before being put in the colorimeter in order to ensure the proper distribution of materials for a uniform reaction. | The photocell of the colorimeter is located at the near bottom of where the cuvette is placed. Because the amylase is initially added to the very top of the cuvette, shaking it briefly makes sure that the reaction can be observed by the photocell. |
Table 3. Controlled variables
Materials
Water bath, 500mL Beaker, 50mL Beaker, Boiling tubes, Thermometer (±0.5ºC), Precision balance (±0.001g), Pipettes, 10.0mL Graduated cylinders (±0.1mL), Colorimeter, Cuvettes, Labquest mini, Stirring rod, Spot plates, Watch glass, Capsules of ⍺-amylase inhibitor (diet pills), 5.0% Amylase solution, 1.0% Iodine solution, 1.0% Starch solution
Method
- Fill the water bath halfway. Place the 500mL beaker (also filled approximately halfway with water) inside.
- Heat to 37.0ºC, ensure temperature is controlled with a thermometer.
- Measure 12.0mL of 5.0% amylase with a 10.0mL graduated cylinder, pour the solution in the boiling tube.
- Place the boiling tube in the 500mL beaker, allowing it to rest upright on the beaker’s walls. Leave 5 minutes to ensure the water surrounding the tube adequately heats the amylase.
- Label the holes on the spot plate 0.020g, 0.040g, 0.060g, 0.080g, 0.100g with pencil.
- Break open 1 ⍺-amylase inhibitor capsule and pour the inhibitor powder into the 50mL beaker.
- Place the watch glass on the precision electronic balance and press tare. Use the flat end of the stirring rod to gently tip some of the powder onto the watch glass until the balance reads 0.020g. Transfer the powder to the appropriate place on the spot plate. Repeat this for all the masses.
- Measure 1.0mL of 1.0% starch with a separate 10.0mL graduated cylinder, with the aid of a pipette. Pour the starch solution into the 0.020g hole on the spot plate and mix the powder and solution together with a separate pipette. Repeat this for all the masses.
- For the control, measure 1.0mL of 1.0% starch and directly add it to a cuvette.
- Add 3 drops of 1.0% iodine solution and gently tap the cuvette until the mixture appears homogeneous.
- Using the amylase graduated cylinder, measure 2.0mL of 5.0% amylase from the boiling tube.
- Calibrate the colorimeter, which will identify and convert transmittance values into recorded absorbance values vs time, with a blank at 430nm (do this between every iteration).
- Set the data collection to last for 5 minutes total, with data being collected at a rate of 60 samples/minute. Press play.
- Pour the amylase into the cuvette, place the lid on, and shake gently a few times. Quickly place the cuvette into the colorimeter.
- For the solutions with starch and inhibitor, transfer the mixture into the cuvette via a pipette, add 3 drops of iodine, and repeat steps 10–14 with all the masses.
- Repeat steps 3–15 for 5 total trials, store the graphs for data analysis.
Safety and Environment
| Hazard | Preventative measures |
| Amylase may be a skin or eye irritant. However, because the concentration of the enzyme was 5.0%, the risk of handling the substance is quite low. | Safety goggles were worn for proper eye protection. Hands were immediately rinsed if they came into contact with the amylase (MSDS, 2007). |
| Glassware including beakers, graduated cylinders, thermometers, and more involved in the experiment have the risk of breaking. | Place equipment on a flat and clear surface, make sure the boiling tube stands upright within the beaker instead of rolling around on the countertop. |
| The walls of the water bath were heated and posed the very low risk of inflicting burns if touched. | Wait for the water bath to cool substantially before pouring the water out. Avoid touching the walls. |
| Environmental precaution | |
| The materials used in this experiment are substances that are either found in the human body (amylase), or that can be ingested into the human body (⍺-amylase inhibitor, starch). Thus, these are not harmful to the environment when disposed of. Only the 1.0% iodine indicator may cause concern, but the low concentration and very small amount used in the experiment renders it safe enough to pour down the drain without any repercussions. | |
Table 4. Safety and environmental precautions
Qualitative observations
- The 1.0% starch solution is a murky clear to white liquid. The inhibitor powder also appears to be white. However, mixing the powder into the starch resulted in the solution turning yellow, with higher masses of inhibitor creating a darker yellow color.
- In the control trials, once the iodine is added to the starch solution, the solution turns a dark blue. Once the iodine is added to a starch and inhibitor solution (any mass), the solution is still primarily dark blue but also appears slightly brown due to the yellow color of the inhibitor dissolved. In the case of this reaction, the colorimeter was set to 430nm in order to detect the presence of yellow from the inhibitor, as it is the complementary wavelength on the color wheel.
- The solution lightened over time as amylase was added and the reaction occurred. However, each cuvette containing any mass of inhibitor showed a final yellow solution, suggesting that the inhibitor was not consumed/converted during the reaction.
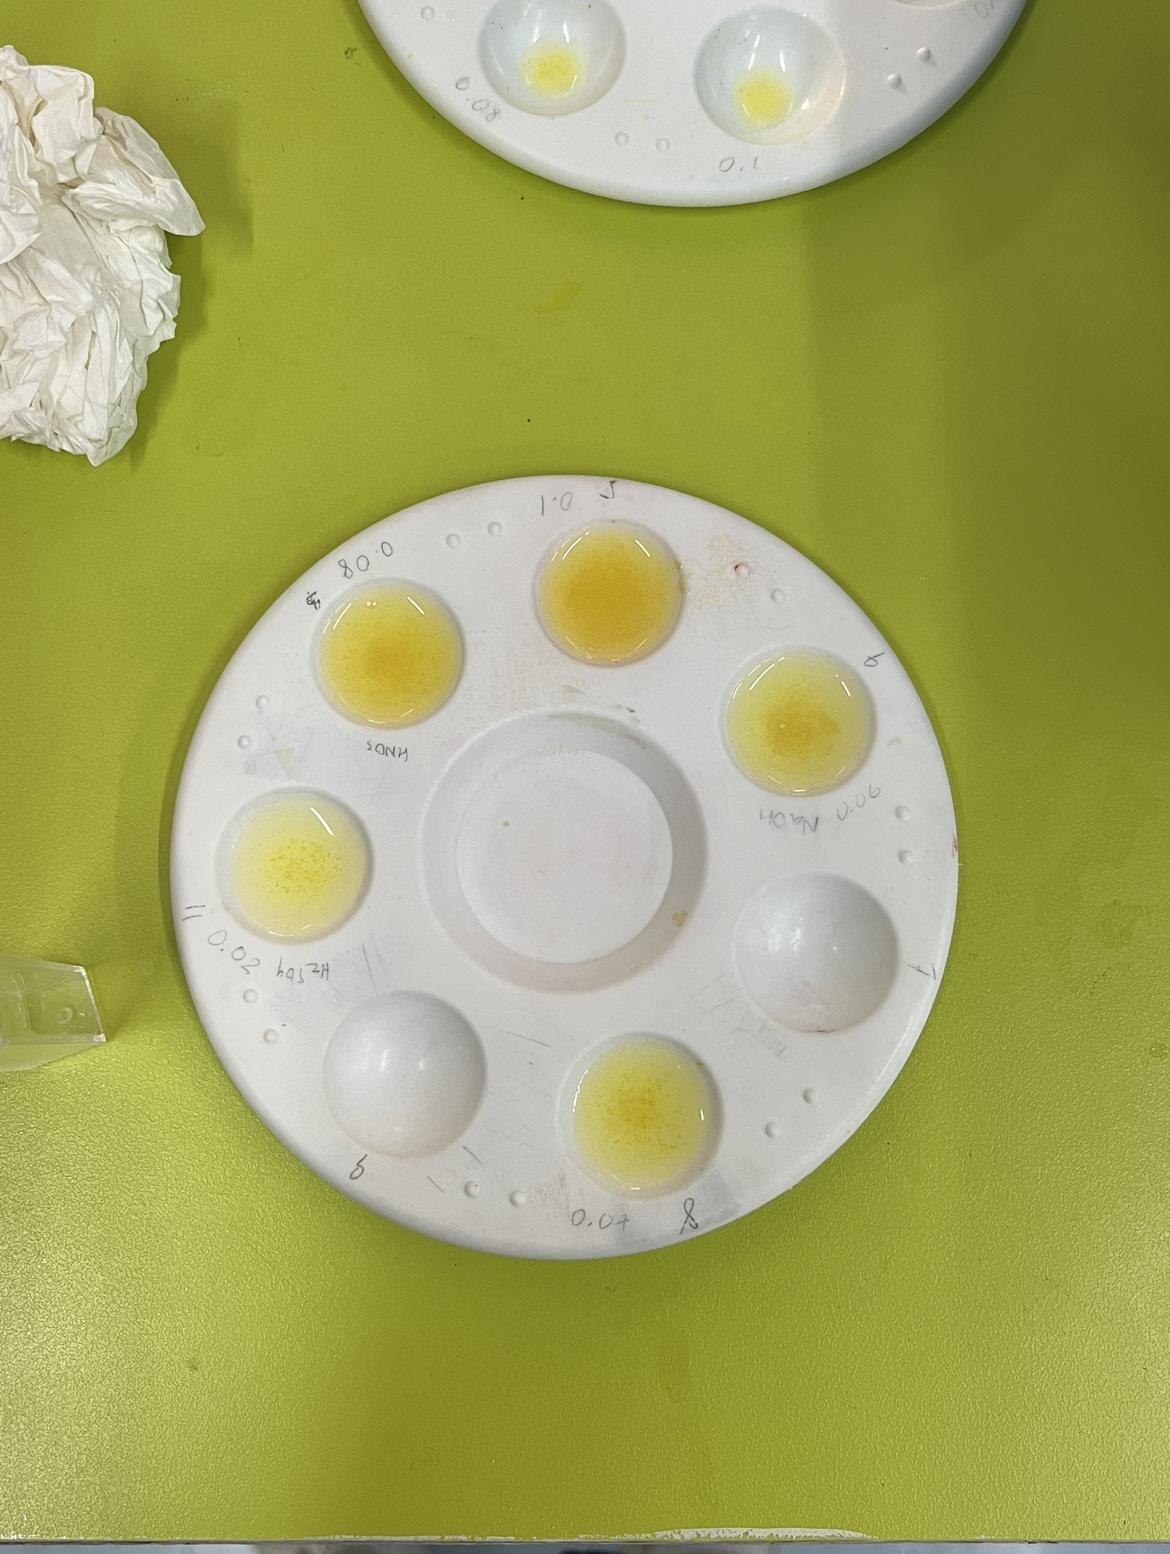 | 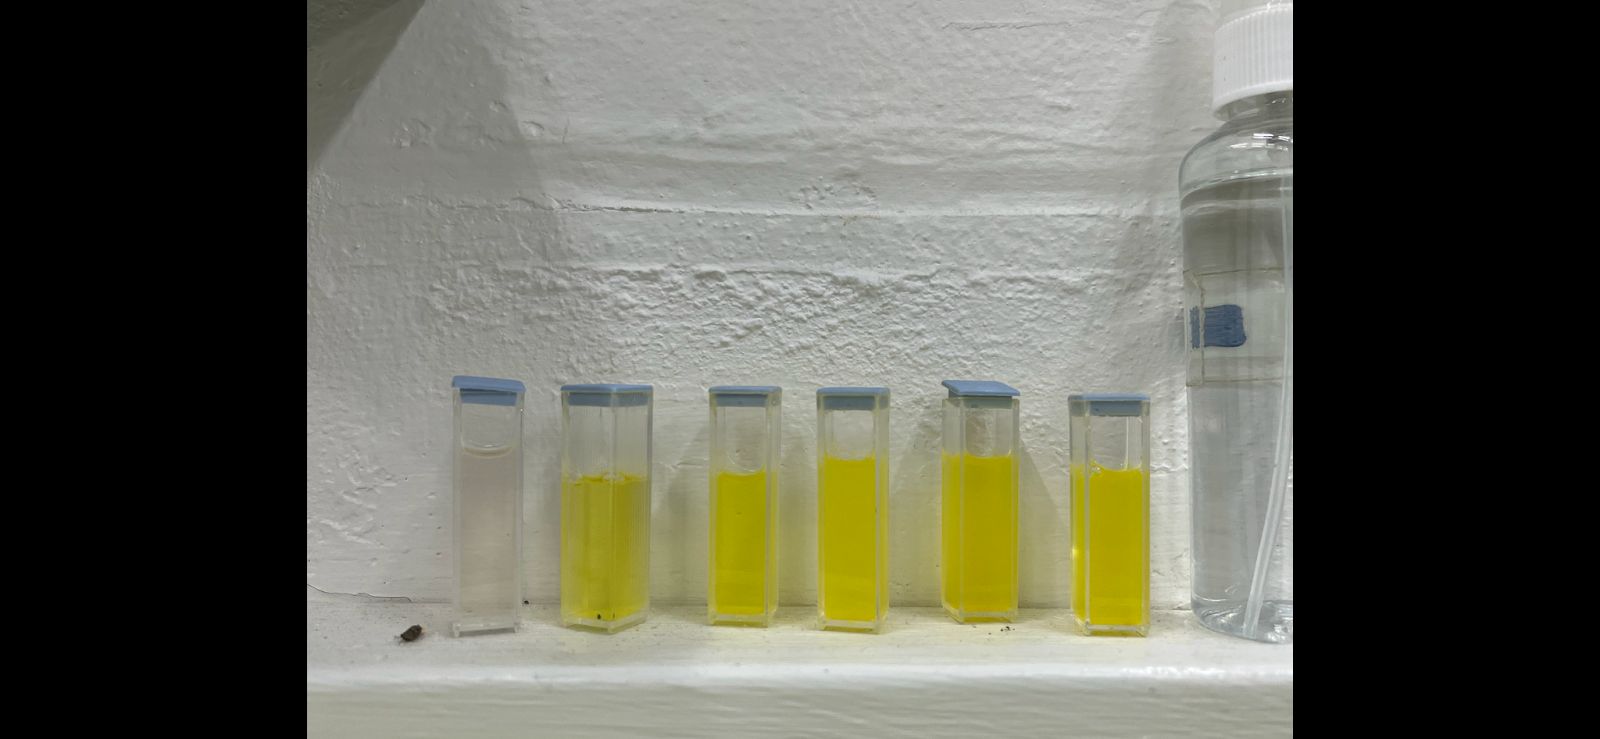 |
| Figure 2. 1.0mL 1.0% starch mixed with varying masses of amylase inhibitor (labeled) on a spot plate before reacting. | Figure 3. Cuvettes after the reaction, (left to right): 0.000g, 0.020g, 0.040g, 0.060g, 0.080g, 0.100g. |
Table 5. Qualitative data
Sample Calculations
Calculation 1: Determining reaction order
In order to determine the reaction order for the starch hydrolysis reaction (thus being able to determine the k value), the absorbance values collected by the colorimeter for a random trial and mass (Trial 2, 0.020 ± 0.001g) were plotted against time (in minutes) in three distinct graphs, as shown below. Conversions were done to the absorbance values prior to them being plotted in the graphs of columns 2 and 3, which will be expanded upon in the next calculation. These graphs were then compared to example graphs for different reaction orders to find the highest degree of correspondence.
Beer’s Law, which states that the concentration of a solution is directly proportional to its absorbance of light (Britannica, 2022), is employed in this instance. Though in normal circumstances, a calibration curve for starch and iodine would be used to convert absorbance values to concentration values, increasing the mass of the inhibitor results in a higher absorbance of the solution before any reaction has occurred (refer to figure 2). Thus, absorbance values were used in all calculations below in place of concentration values.
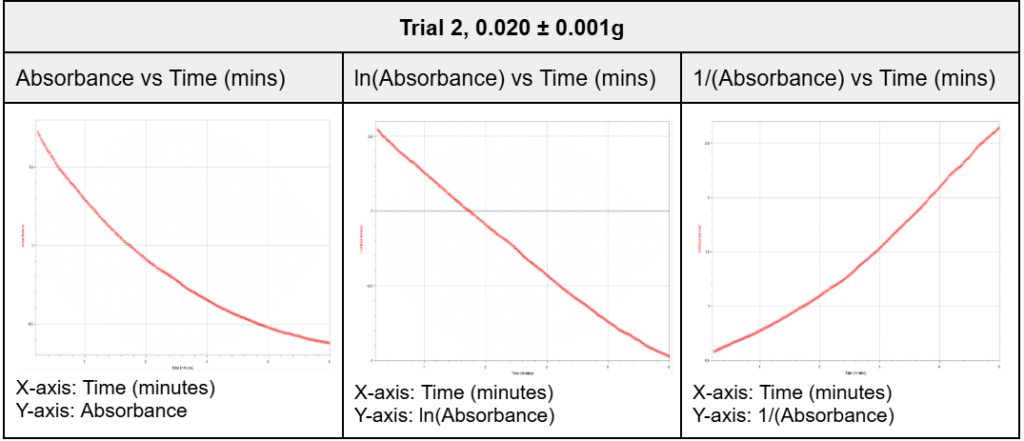
Table 6. Reaction order determination from Trial 2, 0.020 ± 0.001g
Graphs for a First Order Reaction[Concentration] vs Timeln[Concentration] vs Time1/[Concentration] vs Time
In order to determine the reaction order for the starch hydrolysis reaction (thus being able to determine the k value), the absorbance values collected by the colorimeter for a random trial and mass (Trial 2, 0.020 ± 0.001g) were plotted against time (in minutes) in three distinct graphs, as shown below. Conversions were done to the absorbance values prior to them being plotted in the graphs of columns 2 and 3, which will be expanded upon in the next calculation. These graphs were then compared to example graphs for different reaction orders to find the highest degree of correspondence.
Beer’s Law, which states that the concentration of a solution is directly proportional to its absorbance of light (Britannica, 2022), is employed in this instance. Though in normal circumstances, a calibration curve for starch and iodine would be used to convert absorbance values to concentration values, increasing the mass of the inhibitor results in a higher absorbance of the solution before any reaction has occurred (refer to figure 2). Thus, absorbance values were used in all calculations below in place of concentration values.
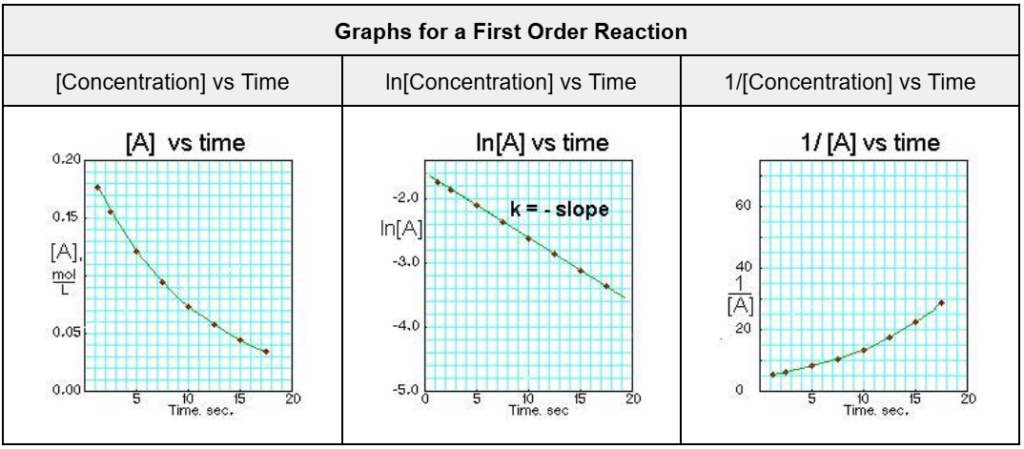
Table 7. First reaction order graphs (Robinson, n.d.)
As shown, the graphs for the starch hydrolysis reaction from the random trial and mass selected (Trial 2, 0.020 ± 0.001g) demonstrate the highest degree of resemblance to graphs of the first reaction order. This would indicate that the rate of the reaction is directly proportional to the concentration of the substrate plus the inhibitor, since both molecules compete for the enzyme’s active site (refer to figure 1).
Hence, the calculations below will be predicated upon the knowledge that the starch hydrolysis reaction is first order.
Calculation 2: Absorbance → ln(Absorbance)
Absorbance: 1.707ln(1.707)=0.5347
Calculation 3: Finding k
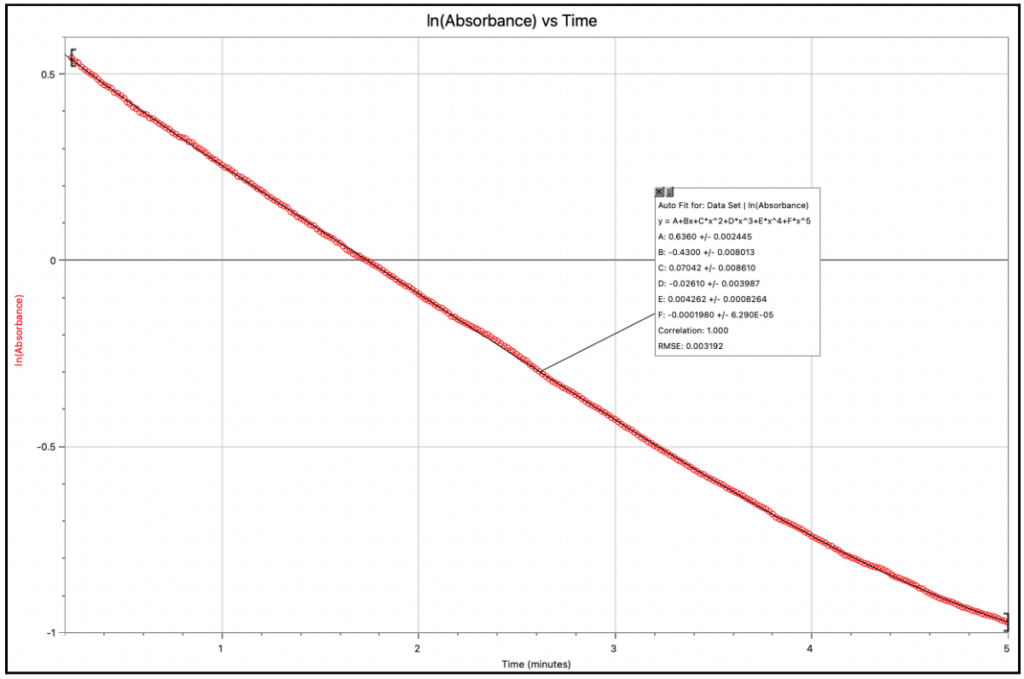
Graph 1. ln(Absorbance) vs Time graph for Trial 2 (0.020 ± 0.001g)
All calculated ln(Absorbance) values were plotted on a graph. The initial rate of reaction was found from the first value of time recorded. The value substituted for x is not 0 because the calorimeter was made to start reading before the cuvette was inserted. This was done so that no vital data points were missed during the initial stages of the reaction, and the absorbance values prior to insertion were just discarded.
f(x)=0.6360-0.4300x+7.04210-2×2-2.61010-2×3+4.26210-3×4-1.98010-4x5f'(x)=-0.4300+(27.04210-2)x-(32.61010-2)x2+(44.26210-3)x3-(51.98010-4)x4f'(x)=-0.4300+0.1408x-7.83010-2×2+1.70510-2×3-9.90010-4×4
f'(0.25)=-0.4300+0.1408(0.25)-7.83010-2(0.25)2+1.70510-2(0.25)3-9.90010-4(0.25)4f'(0.25)=-0.4300+3.52010-2-4.89410-3+2.66410-4-3.86710-6f'(0.25)=-0.3994
This reaction has been established to be first order. Thus, k=-slope for ln(Absorbance) vs Time.
k=-(-0.3994)k=0.3994s-1
| Calculation 4: Mean value of k |
| Mean value of k=(Trial 1+2+3+4+5)5 Example. 0.020gMean value of k=(0.4662+0.3994+0.4162+1.390+1.312)5Mean value of k=0.7968s-1 |
| Calculation 5: Uncertainty |
| Absolute Uncertainty=Range of data2 Example. 0.100 ± 0.001gAbsolute Uncertainty=0.3815-0.12182Absolute Uncertainty=0.25972Absolute Uncertainty=±0.13 (to two significant figures) |
Processed Data
| Mass ⍺-amylase inhibitor (g) (±0.001) | Rate Constant k (s-1) | ||||
| Trial 1 | Trial 2 | Trial 3 | Trial 4 | Trial 5 | |
| 0.000 | 0.6043 | 0.6450 | 0.9049 | 2.005 | 2.031 |
| 0.020 | 0.4662 | 0.3994 | 0.4162 | 1.390 | 1.312 |
| 0.040 | 0.3828 | 0.3341 | 0.2874 | 0.8281 | 0.9119 |
| 0.060 | 0.3193 | 0.2459 | 0.2331 | 0.5887 | 0.4868 |
| 0.080 | 0.2311 | 0.1979 | 0.2074 | 0.3925 | 0.5429 |
| 0.100 | 0.2283 | 0.1218 | 0.1896 | 0.3815 | 0.3257 |
Table 8. Calculated k values over 5 trials. The large disparity in values is explained in table 11, and only values that did not follow the general trend to a great extent, derived when comparing different masses to each other in a single trial (described in the conclusion), were omitted as outliers.
| Mass of ⍺-amylase inhibitor (g) (±0.001) | Mean k value (s-1) | Absolute Uncertainties |
| 0.000 | 1.321 | ±0.097 |
| 0.020 | 0.80 | ±0.50 |
| 0.040 | 0.55 | ±0.31 |
| 0.060 | 0.37 | ±0.18 |
| 0.080 | 0.257 | ±0.097 |
| 0.100 | 0.25 | ±0.13 |
Table 9. Calculated mean values of k
Graph
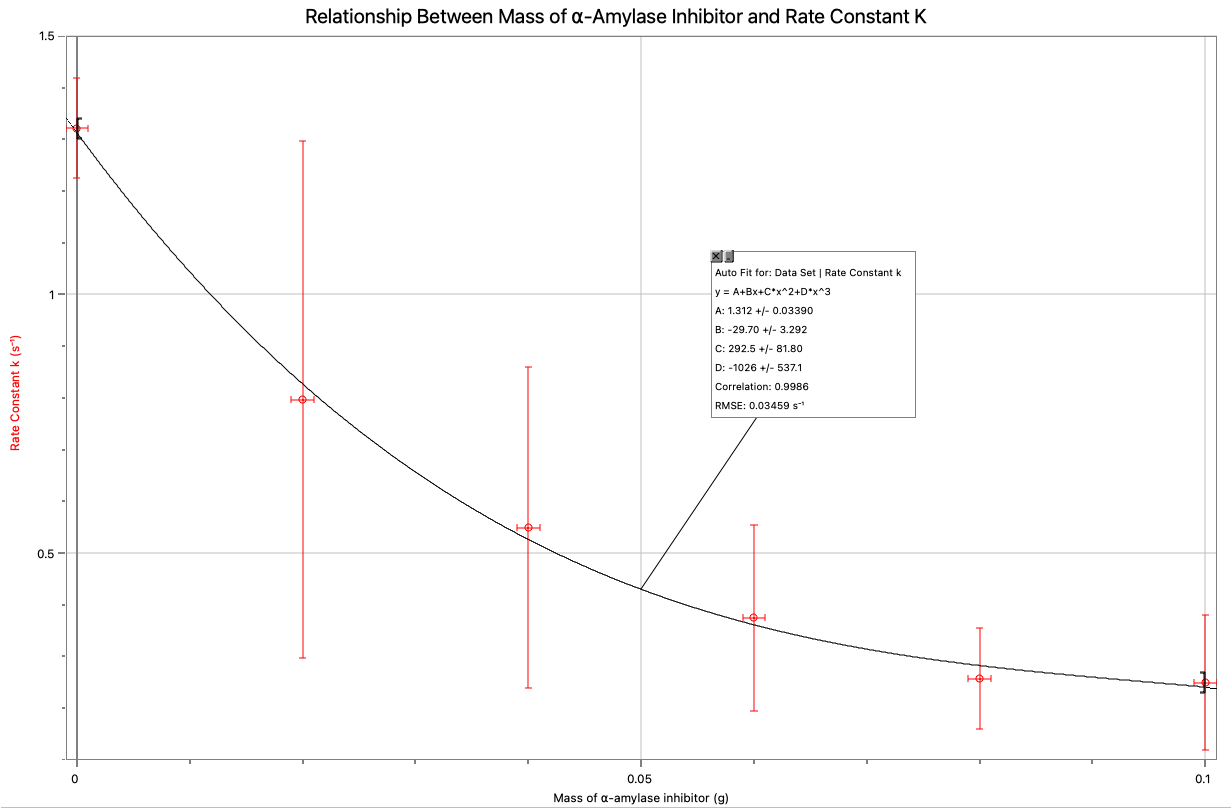
Graph 2. Relationship Between Mass of ⍺-Amylase Inhibitor and Rate Constant k
Conclusion
The results from the data demonstrate that as the mass of ⍺-amylase inhibitor (g) is increased, the calculated rate constant (s–) decreases. This trend is best shown through a line of best fit that curves downwards and begins to plateau in its steepness as the mass of the inhibitor is increased. The average values for each mass demonstrate this trend, with the disparity between the values going from 0.521s– (between 0.000 and 0.020 ± 0.001g) down until 0.007 (between 0.080 and 0.100 ± 0.001g).
This does to an extent validate my hypothesis, which was that the value of k would decrease with an increase in the value of the x axis. However, I had made the assumption that the trend would be linear, which is not what is demonstrated in this case. This relationship may possibly be explained from a Boltzman distribution curve, which demonstrates the relationship between energy and the number of particles in a reaction.
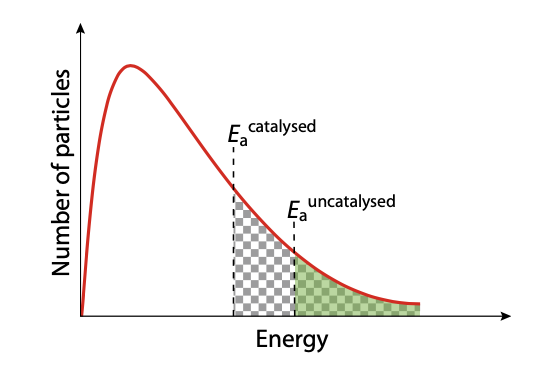
Figure 4. Boltzmann distribution curve
As pictured, the lower the activation energy is from the catalyst, the larger proportion of particles are able to have collisions with enough energy to react to form a product. Thus, as one moves the activation energy further to the right of the x-axis (increasing Ea), the number of particles having successful collisions lessens. However, it can be seen that this is at a nonlinear rate, with the proportions becoming exponentially smaller with the way the graph is shifted. Thus, as the activation energy continues to be raised by the increase in the mass of inhibitor present, there is less of a difference in terms of how many particles will have sufficient energy to react to form a product. Therefore, there is less of a difference in the rate constants as the independent variable is increased.
Explained in terms of the particles themselves, this would mean that even if the substrate (starch) particles were able to bind to the active site of the enzyme, there would be no conformational change that would result in a product, because there is a lack of energy (provided by the hydrolysis of ATP) (Allott, 2014) that will able to overcome the Ea, which was raised due to the inhibitor.
The conclusion synthesized for this experiment should be taken only lightly into consideration due to the high uncertainty of the data collected. The error bars on the graph are very large due to the wide range of data values over the span of the multiple days the data was collected (further elaborated on in table 11). However, it is also important to note that data collected on the same day followed the same general trend, thus adding slight credibility to these results.
Evaluation
| Strengths | Significance |
| Many data points collected | Absorbance values were recorded for 5 minutes at a rate of a sample a second. Thus, I had access to a bit less than 300 data points from when the cuvette had been inserted into the colorimeter. The large amount of raw data collected helped ensure greater accuracy with my calculated k values. |
| Controlled conditions | For the most part, the conditions surrounding the experiment were quite controlled. The temperature of the amylase was kept constant so the enzyme would be working at its optimum, and cross-contamination of equipment was avoided. |
| Strategy of data collection | In order to observe a trend that would not be affected by any strange scaling error, such as what happened during the transition from trial 3 to 4 when they were performed on different days, I tested every variation of the independent variable per trial, instead of doing specific masses on specific days. |
Table 10. Strengths of the experiment
| Limitations | Significance | Improvements |
| Inconsistent colorimeter | Though the same calorimeter was used throughout the entirety of the experiment, and it was calibrated with a blank before any cuvette was inserted for data collection, the data was still inconsistent at times. This was especially noticeable when the colorimeter was used between days, as the measured absorbance values were scaled up immensely in comparison to previous trials. This resulted in incredibly high uncertainty values. | A more reliable colorimeter would have to be sourced for the experiment. All controlled measures (such as calibrating the colorimeter) would still be taken, however all the experimentation should aim to be finished within the shortest period of time possible (whilst still ensuring the quality of the data) to prevent any disparities. |
| Used different bottles of starch due to expiration | There were several bottles of starch that went bad during the experiment. Thus, even though I kept ordering 1.0% starch, I could not ensure that the concentration of starch remained exactly constant throughout the experiment. Expired starch was, of course, unusable. | The fridge used to store the starch was a public fridge so it was constantly opened, which may have affected the quality. Thus, putting the solution somewhere less tampered with could be an improvement. Also, possible contamination could have occurred from bacteria transferred to the starch from bare hands, so it may be advisable to use gloves. |
| Data collected over different days | The first three trials were collected in the same session. Thus, the data values collected were quite similar to each other. The fourth and fifth trials were conducted on another day, and are quite similar to each other, but are scaled quite highly in comparison to the previous three trials. This could have been due to an incorrect calibration of the colorimeter. This did not impact the trend observed in the results too much, since all masses still followed a similar trend in terms of k. | Each trial takes approximately one hour to complete, thus it may be improbable to expect one to complete all five trials in one sitting. Therefore, one should aim to complete more trials in total in order to be able to better identify any outliers from the data trend. |
| Time between the amylase being put into the cuvette, and the cuvette being put into the colorimeter. | There were a few seconds where I had to first transfer the amylase to the cuvette, put the lid on, and shake it briefly before being able to put it in the cuvette. The reaction had already started by then and therefore data from the very beginning of the reaction where the absorbance was the highest was not recorded. | There is a possibility of perhaps placing the opened cuvette in the colorimeter first, adding the amylase and lid, and then shaking it to properly distribute the enzyme. However, this is a technique that requires more precision and though it ensures no data values are missed, it is a bit impractical. |
| High uncertainty of data | Because calculations for absolute uncertainty depend on the range of data points, and because the data collected on different days, though still following a trend, had a large scaling disparity, the uncertainties for the mean values were incredibly high. | An improvement, much like the previous row, could be to perform more trials in order to gather a wider range of data thereby being able to have the ability to eliminate more outliers without affecting the integrity of the results by only having a small sample size. |
Table 11. Limitations of the experiment
Further investigations
- A further investigation could be conducted comparing the effectiveness of many different carb blocker pills in the human body. Looking into the extent to which these are effective, as well as researching possible nutritional deficiencies that may result from taking such supplements is vital in gaining a better understanding of the consequences of trying to lose weight through such a manner.
- Starch, through the amylase enzyme, is only broken down into maltose, which is still a disaccharide and too large to be ingested into the human body. There are still other enzymes, such as maltase, that continue to break maltose down into glucose monomers in the metabolic process (Allott, 2014). There is much less commercially offered in regards to inhibiting maltose. Hence, one could look into where one may find a maltose inhibitor (ex. a specific plant, like legumes for ⍺-amylase inhibitor), and how it may be applied for human consumption.
- Carb blocker pills can be taken by type 2 diabetics to treat high blood sugar levels. One could also look into other diabetic medications that help regulate glucose levels within the body, and the science behind how they function.
References
Allott, A. (2014). Biology: For the Ib diploma. Oxford University Press.
Caballero, B. (2003). Peas and Lentils. In Encyclopedia of Food Sciences and nutrition. essay, Elsevier.
Cornell, B. (n.d.). Enzyme Inhibition. BioNinja. Retrieved October 10, 2022, from https://ib.bioninja.com.au/higher-level/topic-8-metabolism-cell/untitled-6/enzyme-inhibition.html
Encyclopædia Britannica, inc. (2022, September 20). Starch. Encyclopædia Britannica. Retrieved October 10, 2022, from https://www.britannica.com/science/starch
Rafferty, J. P. (2022, September 14). Beer’s law. Encyclopedia Britannica. https://www.britannica.com/science/Beers-law
Hickman, D. (2022, July 8). Why does iodine turn starch blue? ChemistryViews. Retrieved October 11, 2022, from https://www.chemistryviews.org/details/education/10128441/Why_Does_Iodine_Turn_Starch_Blue/#:~:text=Iodine%20Test,changes%20to%20a%20deep%20blue
Jones, T. (2021, February 5). What are carb blockers and do they work? Healthline. Retrieved October 10, 2022, from https://www.healthline.com/nutrition/carb-blockers-101#TOC_TITLE_HDR_6
Libretexts. (2020, August 15). The effect of a catalyst on rate of reaction. Chemistry LibreTexts. Retrieved October 10, 2022, from https://chem.libretexts.org/Bookshelves/Inorganic_Chemistry/Supplemental_Modules_and_Websites_(Inorganic_Chemistry)/Catalysis/The_Effect_of_a_Catalyst_on_Rate_of_Reaction
Libretexts. (2020, September 1). 10.5: Enzyme inhibition. Chemistry LibreTexts. Retrieved October 12, 2022, from https://chem.libretexts.org/Bookshelves/Physical_and_Theoretical_Chemistry_Textbook_Maps/Map%3A_Physical_Chemistry_for_the_Biosciences_(Chang)/10%3A_Enzyme_Kinetics/10.5%3A_Enzyme_Inhibition#:~:text=When%20an%20inhibitor%20interacts%20with,we%20decrease%20the%20inhibitor’s%20concentration
Material Safety Data Sheet – Alpha-Amylase. (n.d.). Retrieved October 12, 2022, from https://fscimage.fishersci.com/msds/88020.htm
Mayo Foundation for Medical Education and Research. (2020, November 4). Pros and cons of weight-loss drugs. Mayo Clinic. Retrieved October 11, 2022, from https://www.mayoclinic.org/healthy-lifestyle/weight-loss/in-depth/weight-loss-drugs/art-20044832#:~:text=Most%20prescription%20weight%2Dloss%20drugs,interfering%20with%20absorption%20of%20fatRobinson, B. (n.d.). Rate Laws from Graphs of Concentration Versus Time (Integrated Rate Laws). Integrated Rate Laws. Retrieved November 17, 2022, from https://www.chem.purdue.edu/gchelp/howtosolveit/Kinetics/IntegratedRateLaws.html